


In the captivating world of baseball, the score isn’t merely a collection of numbers on a giant electronic board; it’s the heartbeat of the game, telling a story that unfolds inning by inning. Understanding baseball scores is akin to deciphering the secret language of America’s favorite pastime. Each run, hit, and error is a brushstroke, contributing to the masterpiece that is a live baseball match.
For fans, grasping the intricacies of baseball scoring is more than just a spectator skill; it’s a pathway to a deeper appreciation of the game’s ebb and flow. Whether you’re a seasoned enthusiast or a newcomer to the sport, delving into the world of baseball scores opens up a realm of insight into player performance, team dynamics, and the strategies that shape the outcome of every match.
Beyond the surface, the score serves as a universal language spoken by fans worldwide. It’s the common ground that unites us in celebration, heartbreak, and sheer excitement. In this guide, we embark on a journey to demystify the numbers that adorn the iconic baseball scoreboard. From the basics of runs and hits to the nuanced art of decoding MLB box scores, we equip you with the knowledge to not just watch but truly comprehend the game.
So, whether you’re a seasoned baseball aficionado or a curious newcomer, join us as we unravel the secrets behind baseball scores, unlocking a richer, more immersive experience within the tapestry of America’s beloved pastime.
Basics of Baseball Scoring: Deciphering Runs, Hits, and Errors
To appreciate the symphony of a baseball game, one must first comprehend its elemental notes—runs, hits, and errors. Each contributes to the narrative unfolding on the diamond, offering fans a detailed account of team performance. Let’s delve into the fundamental aspects of baseball scoring and establish a connection to the intricate world of MLB box scores.
1. Runs: The Currency of Victory
- Definition: A run is scored when a player successfully crosses all four bases and returns to home plate, completing a circuit around the diamond.
- Significance: Runs are the lifeblood of a game, determining which team emerges victorious. The more runs a team accumulates, the greater their chances of success.
2. Hits: Connecting Bat to Ball
- Definition: A hit occurs when a batter strikes the pitched ball and safely reaches a base, without the aid of an error or fielder’s choice.
- Types of Hits:
- Single: Reaching first base.
- Double: Reaching second base.
- Triple: Reaching third base.
- Home Run: A ball hit out of the playing field, allowing the batter to circle all bases.
- Significance: Hits reflect a team’s offensive prowess, showcasing their ability to make solid contact with the ball and advance through the bases.
3. Errors: The Unwelcome Guest
- Definition: An error occurs when a fielder fails to make a play that an average fielder should make, leading to the offensive player reaching a base safely.
- Significance: Errors can dramatically impact the course of a game, offering the opposing team opportunities to score additional runs.
Connection to MLB Box Scores: Unveiling Statistics
- Box Score Overview: MLB box scores provide a comprehensive statistical summary of a game, including runs, hits, and errors.
- Runs and Hits Tally: The box score succinctly displays the runs and hits accumulated by each team, offering a quick glance at the offensive performance.
- Error Tracking: Errors are meticulously recorded, allowing fans and analysts to assess defensive lapses.
Understanding the basics of runs, hits, and errors lays the foundation for deciphering the intricate language of baseball scores. As we proceed, we’ll explore the seamless connection between these on-field actions and the numerical revelations found in MLB box scores. Stay tuned to unlock the full potential of your baseball score comprehension.
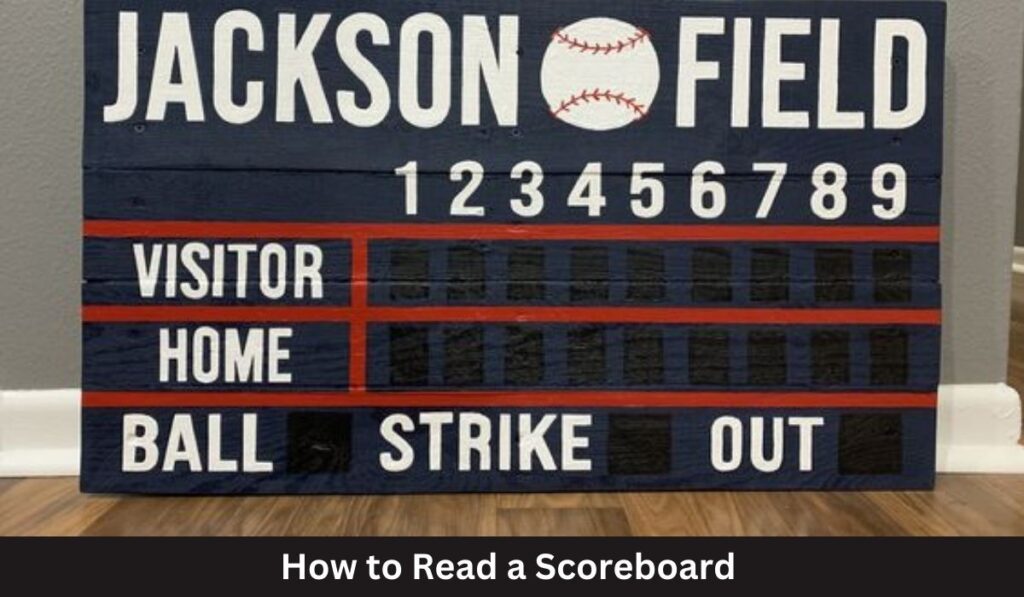
Components of a Baseball Scoreboard: Unveiling the Game’s Canvas
As you settle into your seat at the ballpark, the looming scoreboard becomes the visual epicenter of the baseball experience. This electronic canvas isn’t just a display of numbers; it’s a dynamic storyboard, narrating the ongoing saga of the game. Let’s dissect the key elements on a typical baseball scoreboard and decipher the symbols that compose its language.
1. Inning Display: Navigating the Game’s Chapters
- Location: Usually positioned at the top of the scoreboard.
- Function: Indicates the current inning of the game.
- Significance: In a standard baseball game, each team gets nine innings to bat and field. The inning display keeps fans informed about the progression of the game.
2. Runs, Hits, and Errors Section: A Trifecta of Statistics
- Location: Prominently displayed for both home and away teams.
- Function: Tallies the runs, hits, and errors for each team.
- Significance: Offers a quick snapshot of the game’s offensive and defensive performance, showcasing which team is in the lead.
3. Outs Counter: Gauging Defensive Progress
- Location: Often positioned beneath the runs, hits, and errors section.
- Function: Displays the number of outs recorded in the current inning.
- Significance: Helps fans track the defensive team’s progress in limiting the offensive team’s opportunities.
4. Pitch Count: Analyzing the Battle on the Mound
- Location: Found near the inning display or as a separate section.
- Function: Shows the number of pitches thrown by the starting pitchers.
- Significance: Offers insights into the endurance and efficiency of the pitchers, influencing strategic decisions by managers.
5. Other Symbols and Information: Enhancing the Narrative
- Base Runner Icons: Indicate the presence of runners on base through intuitive symbols.
- Pitch Speed: Displays the velocity of pitches, adding excitement for fans and providing context to the intensity of the game.
- Batter Information: Highlights the current battery, their stats, and perhaps a small image.
Connection to Runs, Hits, and Errors: Translating the Story to Symbols
- Numeric Representation: Each run, hit, and error is visually represented through numerical digits.
- Real-time Updates: The scoreboard dynamically updates after every play, keeping fans engaged with the evolving story on the field.
Understanding the components of a baseball scoreboard transforms it from a mere display to an interactive storytelling device. As we continue our exploration, we’ll delve deeper into the intricacies of reading these elements and interpreting the evolving drama of the game. Stay tuned for a richer appreciation of the baseball scoreboard’s visual narrative.
How to Read MLB Box Scores: Deciphering the Statistical Tapestry
A baseball aficionado’s treasure trove lies within the meticulously crafted pages of an MLB box score. Beyond the simplicity of runs and hits, these statistical masterpieces encapsulate the essence of the game, offering a comprehensive overview of player performances and strategic maneuvers. Let’s embark on an in-depth journey to unravel the intricacies of reading MLB box scores and understand the profound connection between these numbers and the unfolding drama on the field.
1. The Framework of an MLB Box Score
- Sections: Typically divided into two halves representing the competing teams.
- Columns: Runs, hits, errors, and other essential statistics are presented in a structured format.
- Inning-by-Inning Breakdown: Each inning’s performance is detailed, providing a chronological account of the game.
2. Player Stats: The Individual Symphony
- Batting Statistics:
- AB (At-Bats): Number of times a batter has faced a pitcher.
- H (Hits): Successful connections between bat and ball, resulting in the batter reaching base.
- R (Runs): Times a player crosses home plate, contributing to the team’s score.
- RBI (Runs Batted In): Number of runs attributed to a batter’s actions.
- Pitching Statistics:
- IP (Innings Pitched): Number of innings a pitcher has completed.
- SO (Strikeouts): The count of batters a pitcher has struck out.
- BB (Walks): Instances where a pitcher allows a batter to reach base via a walk.
- ER (Earned Runs): Runs scored against a pitcher excluding those resulting from errors.
3. Advanced Metrics: Navigating the Depth
- OPS (On-base Plus Slugging): A combined metric reflecting a player’s ability to get on base and hit for power.
- WHIP (Walks plus Hits per Inning Pitched): Pitcher effectiveness in preventing baserunners.
- ERA (Earned Run Average): Measures the average number of earned runs a pitcher gives up per nine innings.
4. Historical Context: Beyond the Game at Hand
- Streaks and Milestones: Box scores capture hitting streaks, pitching milestones, and noteworthy achievements.
- Player Comparisons: Enables fans to analyze the performance of individual players over time.
Connection to Game Strategy:
- Strategic Decision-Making: Managers use box scores to evaluate player performance and make informed decisions during games.
- Scouting and Analysis: Scouts and analysts rely on box scores for in-depth player evaluations and opponent scouting.
Practical Application: Bringing Numbers to Life:
- Understanding Momentum Swings: Analyzing box scores helps identify pivotal moments that shifted momentum.
- Predicting Player Contributions: A well-read box score can offer insights into potential standout performances in future games.
Reading MLB box scores transcends numbers; it’s an art form that unveils the nuanced dynamics of baseball. As we continue our exploration, we’ll connect these statistical threads to the live action on the field, transforming seemingly abstract figures into a vibrant tapestry of America’s beloved pastime. Stay tuned for a deeper dive into the statistical language of baseball.
Scoreboard Mechanics: The Pulse of Baseball Games Unveiled
As you sit in the stands, eyes fixed on the colossal scoreboard, a symphony of mechanics is at play behind the scenes. The scoreboard is not just a display; it’s a dynamic entity that breathes life into the game, providing real-time updates and orchestrating an intricate dance of information. Let’s delve into the mechanics that govern baseball scoreboards, offering insight into their seamless operation and the flow of information during a live game.
1. Real-time Data Integration
- Data Sources: The scoreboard integrates information from multiple sources in real-time, including the official scorekeeping system, pitch tracking systems, and player statistics databases.
- Sensors and Cameras: Advanced stadiums utilize sensors and cameras to capture every play, instantly updating the scoreboard with accurate data.
2. Dynamic Display Components
- LED Technology: Modern scoreboards predominantly use LED displays for their vividness, clarity, and ability to provide dynamic visuals.
- Multifunctional Panels: Segmented panels allow the scoreboard to display various elements simultaneously, from scores and stats to animations and player profiles.
3. Inning-by-Inning Updates
- Inning Changes: The scoreboard dynamically updates at the end of each inning, reflecting the runs, hits, and errors accrued by each team.
- Pitch-by-Pitch Updates: Some scoreboards provide pitch-by-pitch updates, keeping fans engaged with the evolving game dynamics.
4. Runners on Base and Game Situation
- Base Runner Icons: Animated icons signify the presence of runners on base, enhancing the visual representation of the current game situation.
- Game Context Graphics: The scoreboard may display graphics indicating key moments, such as a close game or a potential scoring opportunity.
5. Pitch Speed and Player Stats
- Pitch Speed Display: A staple feature, showcasing the velocity of each pitch thrown, adding excitement and context to the game.
- Player Stats Rotation: Periodic rotations of player statistics, highlighting key players and their current performance.
6. Integration with Entertainment
- Between Innings: The scoreboard seamlessly transitions to entertainment content between innings, engaging fans with trivia, fan cams, and sponsor messages.
- Interactive Features: Some scoreboards allow fans to participate in interactive activities, further enhancing the overall fan experience.
7. Information Flow and Connectivity
- Network Connectivity: Scoreboards rely on a robust network infrastructure to ensure real-time connectivity with various data sources.
- Redundancy Systems: To prevent disruptions, scoreboards often incorporate redundancy systems, ensuring continuous operation even in the event of technical glitches.
Connection to Fan Engagement:
- Instant Reactions: Scoreboards provide immediate reactions to plays, eliciting cheers or groans from the crowd.
- Enhanced Viewing Experience: Real-time updates create an immersive experience for both attending and remote fans.
Understanding the mechanics behind baseball scoreboards allows fans to appreciate the intricacies of their favorite pastime. In the next phase of our exploration, we’ll unravel the meanings behind the numbers and symbols on the scoreboard, empowering you to decode the live action with a newfound depth of understanding. Stay tuned for a closer look at the symbiotic relationship between the scoreboard and the game it portrays.
Understanding Baseball Numbers: Decoding the Symbolic Language of the Scoreboard
As the digits flicker on the scoreboard, each number tells a nuanced story, painting a vivid picture of the ongoing baseball saga. Beyond mere statistics, these numbers embody the essence of the game, offering insights into player performance, team strategy, and the unfolding drama on the diamond. Let’s embark on a detailed exploration, unraveling the significance of each number and connecting them to the dynamic ebb and flow of baseball.
1. Inning Display
- Explanation: The inning display reveals the current stage of the game, from the initial innings to the potential extra frames.
- Connection to Dynamics: Inning numbers dictate the progression of play, influencing strategic decisions, and intensifying as the game unfolds.
2. Runs, Hits, and Errors Section
- Explanation:
- Runs (R): Represents the total number of times a team has successfully crossed home plate.
- Hits (H): Signifies the number of successful connections between bat and ball, allowing a batter to reach base.
- Errors (E): Reflects defensive lapses, showcasing the number of times a fielding error has occurred.
- Connection to Dynamics: This trio encapsulates the team’s overall performance, reflecting offensive prowess, defensive struggles, and the overall competitiveness of the game.
3. Outs Counter
- Explanation: Displays the number of outs recorded in the current inning.
- Connection to Dynamics: The outs counter dictates defensive progress, determining the end of an inning and affecting strategic decisions.
4. Pitch Count
- Explanation: The pitch count reveals the number of pitches thrown by the starting pitchers.
- Connection to Dynamics: Pitch count influences managerial decisions, showcasing a pitcher’s endurance, effectiveness, and the evolving battle on the mound.
5. Base Runner Icons
- Explanation: Animated icons represent the presence of runners on base.
- Connection to Dynamics: These icons visually convey the complexity of the game situation, hinting at potential scoring opportunities and strategic decisions.
6. Player Stats Rotation
- Explanation: Periodic rotations of player statistics highlight individual performances.
- Connection to Dynamics: Player stats rotations keep fans updated on key contributors, influencing the narrative of the game and fan perceptions.
7. Pitch Speed Display
- Explanation: Showcases the velocity of each pitch thrown during the game.
- Connection to Dynamics: Pitch speed adds excitement, providing context to the intensity of the game and influencing batter-pitcher dynamics.
8. Advanced Metrics (OPS, WHIP, ERA, etc.)
- Explanation: Advanced metrics offer a deeper understanding of player and team performance.
- Connection to Dynamics: These metrics go beyond basic statistics, providing insights into player efficiency, offensive capabilities, and pitching effectiveness.
Understanding these baseball numbers transcends statistical analysis; it’s a journey into the heartbeat of the game. As we continue our exploration, we’ll bridge the gap between these numbers and the live action on the field, unveiling the intricate dance of strategy, skill, and unpredictability that defines the sport. Stay tuned for a closer look at how these numbers come alive during the unfolding drama of America’s beloved pastime.
Common Misconceptions: Clarifying the Scoreboard Enigma
In the captivating realm of baseball, misconceptions often shroud the true meaning behind the numbers on the scoreboard. These myths can hinder fans from fully appreciating the intricacies of the game. Let’s debunk some common misunderstandings, unraveling the mystery surrounding specific numbers and terms that often lead to confusion.
1. RBI (Runs Batted In) vs. Runs Scored
- Misconception: Confusing the role of RBI and runs scored.
- Clarification: Runs Batted In (RBI) signifies a player’s contribution to runs scored by teammates, while runs scored represents the number of times a player crosses home plate. A player can drive in runs without necessarily scoring them.
2. Errors Impact on ERA
- Misconception: Believing that errors directly affect a pitcher’s Earned Run Average (ERA).
- Clarification: ERA only considers earned runs, which excludes those resulting from errors. Errors impact defensive statistics but not a pitcher’s ERA calculation.
3. Batting Average vs. On-Base Percentage (OBP)
- Misconception: Equating Batting Average with On-Base Percentage.
- Clarification: Batting Average measures hits per at-bat, while OBP includes additional factors such as walks and hit-by-pitches. OBP provides a more comprehensive view of a batter’s ability to reach base.
4. Pitcher Wins (W) and Losses (L)
- Misconception: Overvaluing pitcher wins as the sole indicator of performance.
- Clarification: Pitcher wins and losses are team-dependent and may not accurately reflect individual performance. Other metrics, like ERA and strikeouts, offer a more nuanced evaluation of a pitcher’s contribution.
5. Stolen Bases vs. Caught Stealing
- Misconception: Focusing solely on successful stolen bases without considering caught stealing.
- Clarification: Stolen bases and caught stealing together form a comprehensive picture of a player’s baserunning skills. A high success rate in stolen bases is more favorable.
6. Total Bases Misinterpretation
- Misconception: Misunderstanding the significance of total bases.
- Clarification: Total bases represent the sum of a player’s hits, giving different weights to singles, doubles, triples, and home runs. It provides a quick measure of a player’s offensive impact.
7. Run Differential and Game Dynamics
- Misconception: Neglecting the importance of run differential in evaluating team performance.
- Clarification: Run differential (runs scored minus runs allowed) is a strong indicator of a team’s overall performance, reflecting both offensive and defensive capabilities.
8. Quality Starts
- Misconception: Overestimating the significance of quality starts.
- Clarification: Quality starts (pitching at least six innings with three or fewer earned runs) provide a benchmark but don’t capture the full context of a pitcher’s effectiveness. Additional metrics are needed for a comprehensive evaluation.
Addressing these misconceptions not only enhances fan understanding but also fosters a deeper appreciation for the intricate tapestry of baseball statistics. As we navigate through the next chapters, we’ll continue to dispel myths and ensure clarity, empowering fans to read the scoreboard with confidence and insight. Stay tuned for a journey into the nuances of America’s beloved pastime.
Practical Examples: Navigating the Scoreboard Landscape in Real Time
Let’s embark on a practical journey, applying the knowledge gained in our exploration of baseball scores to real-life scenarios. Through detailed walkthroughs of sample scoreboards and box scores, we’ll illuminate the application of this knowledge, allowing fans to seamlessly navigate the dynamic landscape of a live baseball game.
Sample Scoreboard Walkthrough
Inning Display (Top 3rd):
- Scenario: We’re in the top of the 3rd inning.
- Analysis: The game is still in the early stages, and both teams have opportunities to set the tone.
Runs, Hits, and Errors Section (Home: 2 Runs, 3 Hits, 0 Errors; Away: 1 Run, 2 Hits, 1 Error)
- Scenario: The home team is leading with 2 runs, 3 hits, and no errors. The away team has 1 run, 2 hits, and 1 error.
- Analysis: The home team has been more effective offensively, with fewer errors. The away team faces defensive challenges.
Outs Counter (2 Outs):
- Scenario: There are 2 outs in the current inning.
- Analysis: The defensive team is close to concluding the inning, while the offensive team is striving to extend their turn at bat.
Pitch Count (Home: 45 Pitches, Away: 38 Pitches):
- Scenario: The home team’s pitcher has thrown 45 pitches, and the away team’s pitcher has thrown 38 pitches.
- Analysis: Both pitchers are relatively efficient, but pitch count can influence managerial decisions in the later innings.
Base Runner Icons (None):
- Scenario: No base runner icons are displayed.
- Analysis: Bases are currently empty, indicating a neutral situation without immediate scoring threats.
Sample Box Score Walkthrough
Player Stats Rotation (Highlighted Batter: .320 AVG, 2 H, 1 R, 3 RBI):
- Scenario: A highlighted batter has a batting average of .320, recorded 2 hits, scored 1 run, and driven in 3 runs.
- Analysis: This player is a key contributor, showcasing consistent hitting and the ability to drive in runs.
Pitcher Stats (6 IP, 8 SO, 1 BB, 2 ER):
- Scenario: The starting pitcher completed 6 innings, struck out 8 batters, walked 1, and allowed 2 earned runs.
- Analysis: A strong performance, balancing strikeouts with control. The earned run count provides context to their overall effectiveness.
Advanced Metrics (OPS: .900, WHIP: 1.00, ERA: 3.00):
- Scenario: A batter’s OPS is .900, pitcher’s WHIP is 1.00, and pitcher’s ERA is 3.00.
- Analysis: The batter has a solid on-base plus slugging percentage, while the pitcher maintains good control and a reasonable earned run average.
Real-Game Scenarios
Late-Inning Comeback Attempt:
- Scenario: The home team, trailing by 3 runs in the 8th inning, loads the bases with one out.
- Analysis: Understanding the scoreboard, fans anticipate a potential momentum swing. The offensive team aims to capitalize on scoring opportunities, and the defensive team seeks crucial outs.
Pitcher Change Decision:
- Scenario: A starting pitcher has thrown 110 pitches through 7 innings, maintaining a slim lead.
- Analysis: The manager, considering pitch count and game dynamics, faces a strategic decision regarding whether to keep the starting pitcher or bring in a relief pitcher.
Through these practical examples, fans gain the ability to interpret live games, analyze strategic decisions, and appreciate the impact of individual performances. As we proceed, we’ll continue to sharpen these skills, fostering a deeper connection between scoreboard numbers and the vibrant narrative of baseball in action. Stay tuned for more insights into the heart of America’s beloved pastime.
Scoreboard Tips for Fans: Elevating Your Live Baseball Experience
As you step into the vibrant atmosphere of a live baseball game, the scoreboard becomes your interactive guide to the unfolding drama on the field. To make the most of this experience, here are tips tailored for fans attending games, offering insights on reading scoreboards and enhancing your overall enjoyment of America’s favorite pastime.
1. Familiarize Yourself with Scoreboard Layout
- Tip: Take a moment to scan the scoreboard layout before the game starts.
- Why: Familiarizing yourself with the positioning of key elements such as inning display, runs, hits, and errors ensures you can quickly grasp the game’s current status.
2. Follow the Inning Progression
- Tip: Keep a close eye on the inning display at the top of the scoreboard.
- Why: Understanding the inning progression provides context for the game’s narrative and allows you to anticipate critical moments.
3. Interpret Runs, Hits, and Errors
- Tip: Regularly check the runs, hits, and errors section for both teams.
- Why: This trio of statistics encapsulates a team’s overall performance, offering insights into offensive prowess and defensive struggles.
4. Stay Aware of Outs
- Tip: Monitor the outs counter throughout the game.
- Why: The outs counter influences strategic decisions and knowing the defensive team’s progress keeps you engaged in the game dynamics.
5. Watch for Base Runner Icons
- Tip: Keep an eye on base runner icons to understand the current baserunning situation.
- Why: Base runner icons visually represent potential scoring opportunities, adding an extra layer of excitement to the game.
6. Embrace the Pitch Count
- Tip: Glance at the pitch count to gauge pitcher endurance and effectiveness.
- Why: Pitch count influences managerial decisions and provides insights into the evolving battle on the mound.
7. Dive into Player Stats Rotations
- Tip: Pay attention to rotations of player statistics on the scoreboard.
- Why: These rotations highlight key contributors, allowing you to appreciate standout performances and track player dynamics.
8. Engage with Entertainment Between Innings
- Tip: Enjoy the between-inning entertainment on the scoreboard.
- Why: Entertainment segments enhance the overall experience, adding fun and excitement during breaks in the action.
9. Be Mindful of Real-time Updates
- Tip: Stay attentive to real-time updates on the scoreboard.
- Why: Immediate reactions to plays keep you connected to the live action, fostering a sense of involvement in the game’s ebb and flow.
10. Connect with Fellow Fans
- Tip: Strike up conversations with fellow fans about the scoreboard and game dynamics.
- Why: Sharing insights and observations enhances the communal aspect of attending live games, creating a memorable experience.
By incorporating these tips, you transform the scoreboard from a display of numbers into an interactive companion, enriching your live baseball experience. Whether you’re a seasoned fan or a newcomer, decoding the scoreboard enhances your ability to savor the nuances of the game. As we continue our journey into the heart of baseball, stay tuned for more insights that elevate your connection to America’s beloved pastime.
Conclusion: Unlocking the Beauty of Baseball’s Scoreboard Symphony
In our exploration of baseball’s scoreboard, we’ve delved into a world where numbers come alive, telling the captivating story of each game. From the inning-by-inning dance to the intricate player stats rotations, we’ve deciphered the symbolic language that unfolds on the diamond. As fans, understanding the scoreboard isn’t just about decoding statistics; it’s about immersing ourselves in the rich tapestry of America’s beloved pastime.
Recapping key points, we’ve learned to navigate the scoreboard landscape, interpreting runs, hits, and errors as more than mere digits. We’ve explored the dynamics of the game through the lens of the inning display, outs counter, and base runner icons. Practical examples have demonstrated how to apply this knowledge in real-game scenarios, transforming scoreboard numbers into a vibrant narrative.
Encouraging fans to engage more deeply, we invite you to embrace the thrill of every pitch, savor the strategic decisions, and celebrate the standout performances that make each baseball game a unique spectacle. Whether you’re a seasoned aficionado or a newcomer to the sport, the scoreboard is your guide to the heart of the action. So, next time you’re at the ballpark, let the scoreboard be your companion in the symphony of baseball, and relish the beauty of the game that unites us all.
How much did you like Unlocking Baseball Scores: How to Read a Scoreboard Guide? Share your view in the comment box. Also, share this blog with your friends on social media so they can also enjoy it. For more blogs, visit baseballpropicks.com
Related Article:
- Cultural Impact: Baseball Caps in Fashion
- Understanding the Basics of Baseball
- Historical Moments in Baseball
- Inside Baseball: The Core Cover
- Best Baseball Gloves by Positions

Meet Daniel Anderson, the heart and soul behind Baseball Pro Picks. At 49, Daniel’s life has revolved around baseball, a passion that’s as strong today as it was when he first fell in love with the game. Living in the USA, Daniel has dedicated countless hours to watching, analyzing, and understanding every pitch, hit, and home run, making almost no game missed. His deep-rooted love for the sport is matched only by his commitment to sharing insightful, expert analysis with fellow baseball enthusiasts. With decades of experience and a keen eye for the game’s nuances, Daniel brings a unique perspective that enriches Baseball Pro Picks. Trust Daniel to guide you through the intricacies of baseball with the authority and trustworthiness of a true aficionado.